

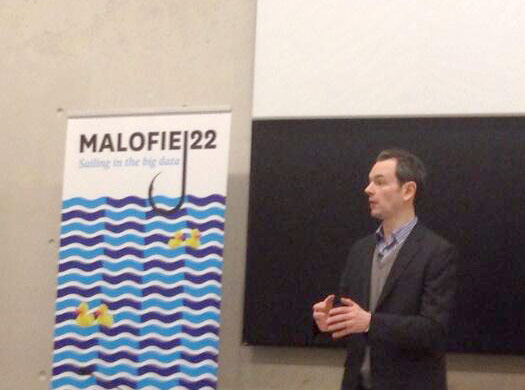
Photo by Alberto Molina
March 31, 2014
This is a summary of my talk last Thursday at the 22nd Malofiej conference at the University of Navarra, Pamplona.

As with previous talks, I'm writing from memory so this is an approximation of what I said.
Good afternoon, my name is Jonathan Corum from The New York Times. I design most of their science graphics.
I'm honored to be here at the 22nd Malofiej conference, but I must admit I was a little confused by all the ducks.
There are ducks behind me, ducks on the Malofiej posters ...
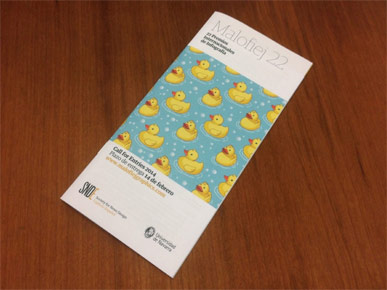
... and ducks on the brochure.

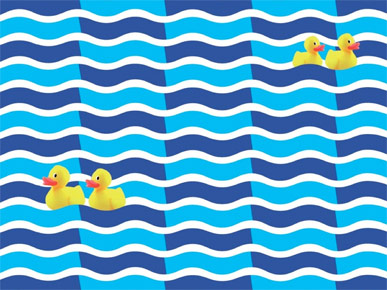
And it took me a while to realize that the ducks are supposed to represent the number 22.
I didn't know until now that in the game of bingo, all the numbers up to 90 have nicknames.
And the nickname for the number 22, in both English and in Spanish, is two little ducks. Los dos patitos.

If you can't quite see two ducks here ...
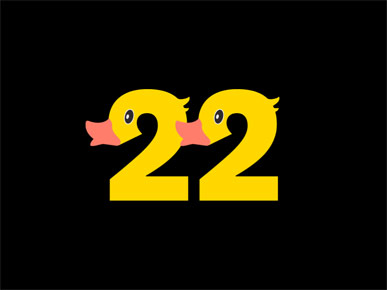
... then maybe this will help.
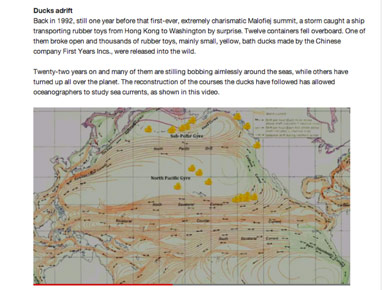
On the Malofiej web site, I saw a short post about thousands of plastic ducks that have been circling the ocean for 22 years.
This sounded familiar to me, so I started reading more about it, and it's a fascinating story.

In January 1992, this ship, the Ever Laurel, lost a dozen or so shipping containers during a storm.
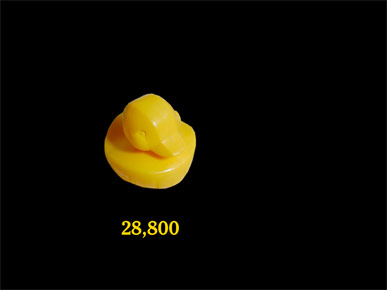
One of the containers broke open, and released almost 29,000 plastic bath toys.
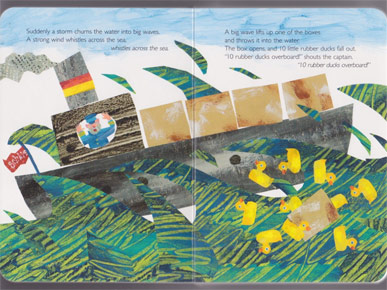
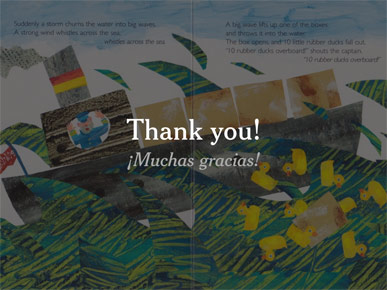
There are no photos of the spill, but a children's book about the ducks drew it like this.
My son is almost 2, and when he sees this page he says "Ducks overboard!"
So the ducks fell overboard and have been circling the oceans for 22 years, occasionally washing up on shore somewhere.
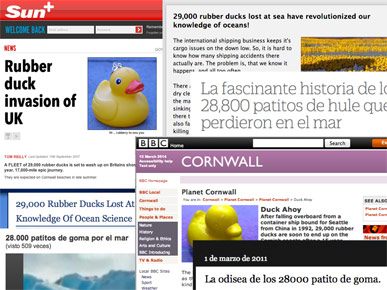
And every few years when a duck washes ashore or the ducks are predicted to make landfall in a new part of the world, the story will reappear in articles and blog posts.
Here are a few examples in English and Spanish, all mentioning 29,000 ducks.
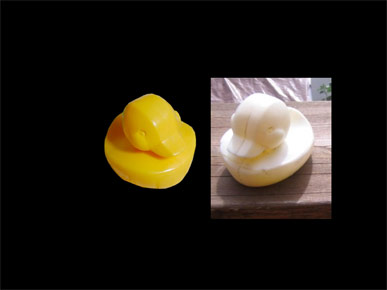
We know what the ducks look like. They were angular and yellow, but years at sea in the sun and wind have faded them to an ivory white.

But I was surprised to see that most of the coverage used images like these, of a classic duck with orange bill and blue eyes.
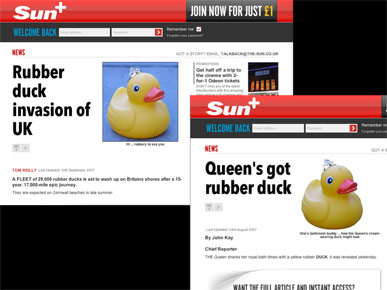
I particularly liked that the Sun seems to have one duck that they reuse for all their rubber duck stories.

We also know the location where the container went overboard.
This is not big data — just one data point to start with — but knowing the location of the spill makes the ducks interesting for research into ocean drift.
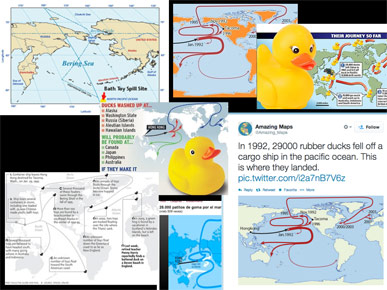
But when I went to look for maps, most of the ones I found did not even have that one location correct.
The starting point might be off by a few hundred miles or more ...
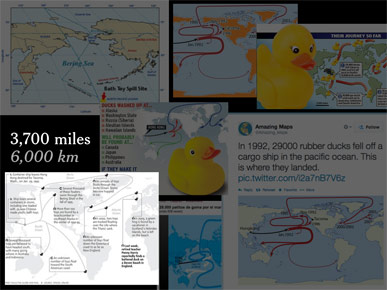
... and for the map at lower left, the location was off by about 3,700 miles, or 6,000 km.
But the most surprising thing to me wasn't that the pictures were inaccurate, or that the maps showed the wrong location for the spill.
What surprised me was that there weren't 29,000 ducks.
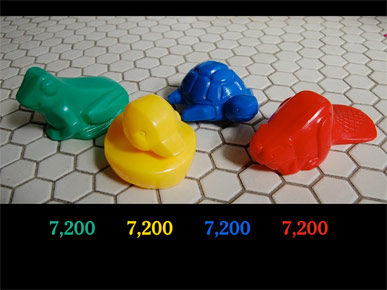
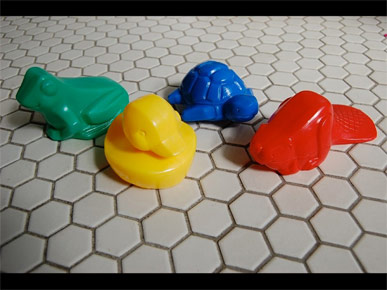
There were actually four kinds of bath toys lost overboard.
And there was something about the ducks that made people ignore the green frogs, blue turtles and red beavers.
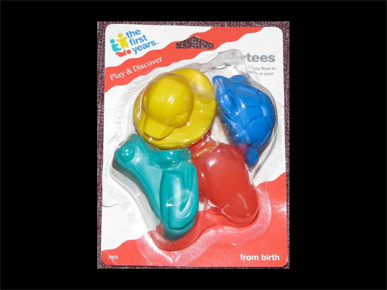
The toys were packaged like this. When 7,200 of these packages fell overboard, seawater dissolved the cardboard backing the animals were freed.
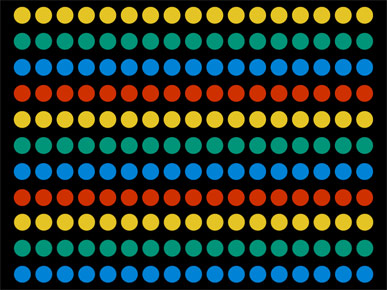
So as we meet at Malofiej to talk about working with data, presenting data and visualizing data, I think this is a good reminder that, if your data looks something like this ...

... don't pretend that it looks like this, just because it makes a better story.
This is a type of storytelling with data, but it's the wrong type. This is more of a fiction or a fable than an accurate report.

It's tempting to say something about online journalism or blogging, but in this case I think much of the blame actually lies elsewhere ...
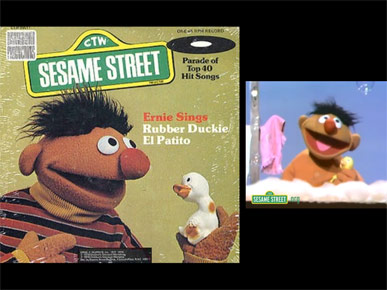
... with Ernie, from Sesame Street.
In 1970, 22 years before the container spill, Ernie sang a song about a rubber duckie.
I remember hearing the song when I was young ...

... and it's apparently that song that raised the little yellow duck to an icon of popular culture.
My son hasn't heard Ernie sing, but he has grown up surrounded by little yellow ducks.
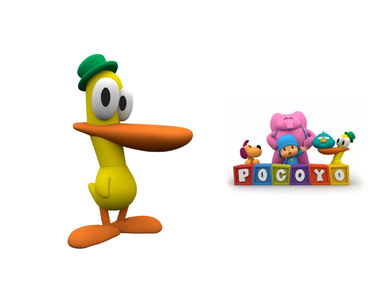
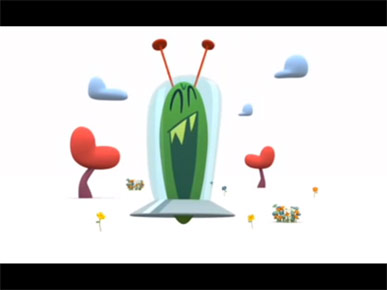
And he is familiar with the character Pato on the Spanish cartoon show Pocoyo, which has a lovely design if you haven't seen it.
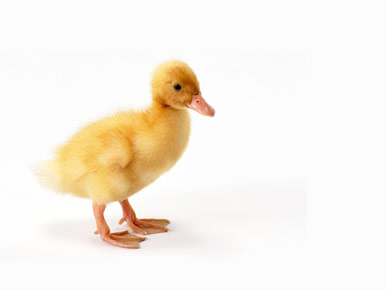
All of the ducks we've seen so far are idealized abstractions of a species of duckling.
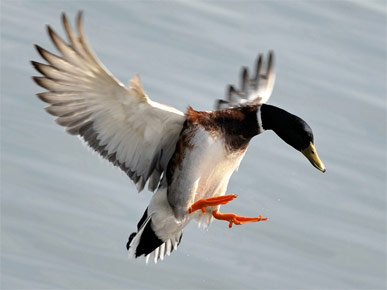
But if you look back through all the years of human history, our ancestors were probably more concerned with ducks like this, for food.
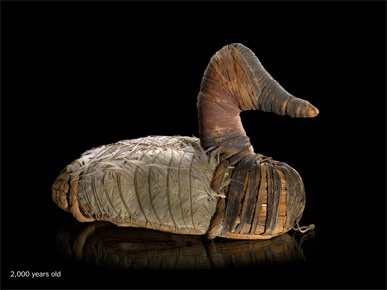
This is a Native American hunting decoy from about 2,000 years ago. A beautiful design.
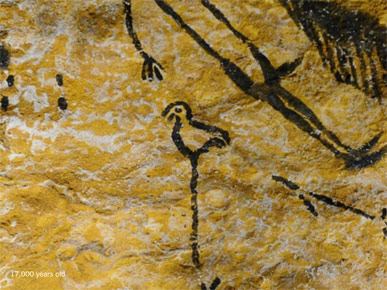
A bird painted on the walls of the Lascaux Caves in France about 17,000 years ago. Lovely lines.
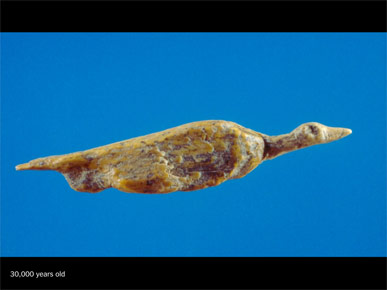
And even farther back, a 30,000 year old statue of a duck in flight, carved from mammoth ivory. This is from Germany, and is one of the oldest sculptures ever found.

But if you fast forward 30,000 years, this is what most people think of when they think of a duck.
It's a symbol of childhood, and innocence. And ducks like this tend to have a predictable scale, to fit within a narrow range of sizes ...
... until someone makes something like this.
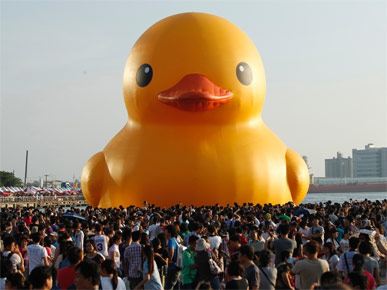
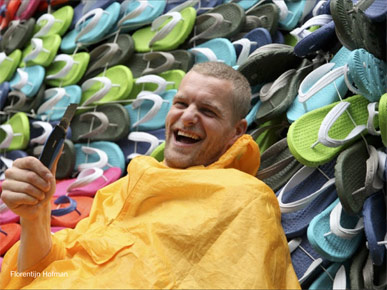
This is a large inflatable duck made the Dutch artist Florentijn Hofman.
He's made several ducks at different sizes, which have been touring Asia and other parts of the world.
I'm not an art critic, but I certainly understand this idea of changing the scale.
Taking something that's familiar and pulling it into an unfamiliar context.
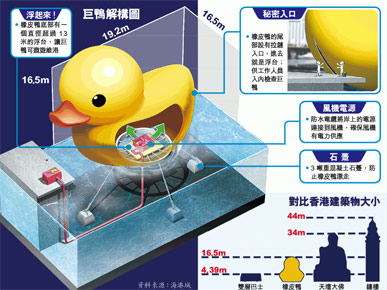
People have tried to make graphics about the duck, but when I look at this graphic my eyes want to see a small duck, even though my brain knows it's supposed to represent a big duck.
There is a scale at lower right, but I'm clearly not the intended audience. I assume this is a silhouette of a Buddha and a building, but I don't recognize the reference.
So when I look at this, I only see a small duck with some kind of microchip inside.

But if you see the duck in context — this is Hong Kong harbor — then you immediately begin to understand how large it is. The buildings and boats give an immediate sense of scale.
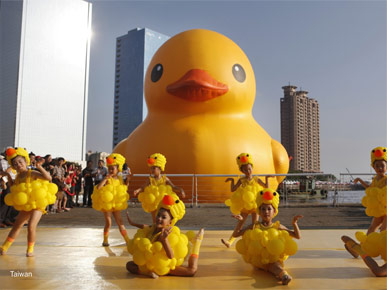
And sometimes I find that it's easier to estimate the size of an object if it's compared to a person, like these children ...
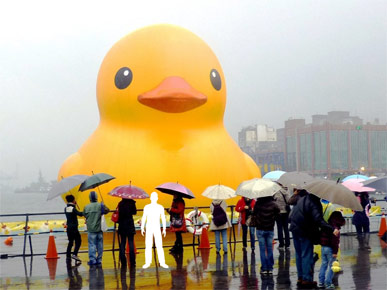
... or these adults.
And we do this in graphics all the time, but using a silhouette instead of an actual person.

So I'd like to talk a little about the adventures of drawn-to-scale man.
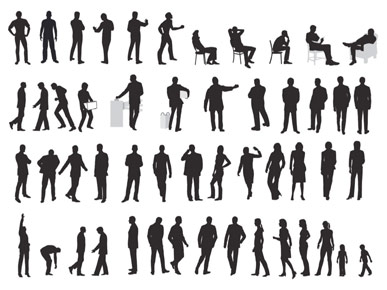
Over the years, Frank O'Connell on the Times graphics desk has drawn dozens of men and women and children for different graphics.
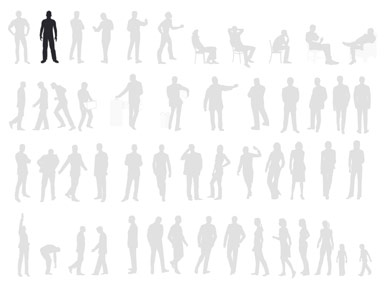
But for some reason, in recent years we've used this one more often than the rest.
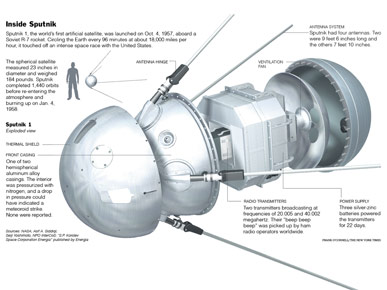
He was originally drawn for a graphic about the 50th anniversary of the Sputnik satellite.
Before I saw this graphic, I really didn't have a clear sense of how large Sputnik was. I thought it was more like a basketball.
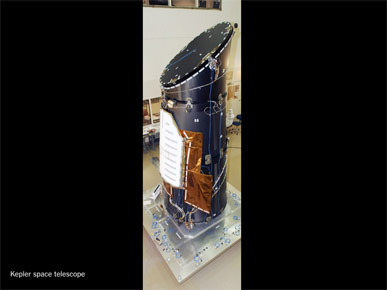
And you can see a similar uncertainty in something like the Kepler space telescope.
From this photograph it's hard to tell how large the telescope is. Would this fit in my hands, or on this desk, or would it touch the ceiling of this room?
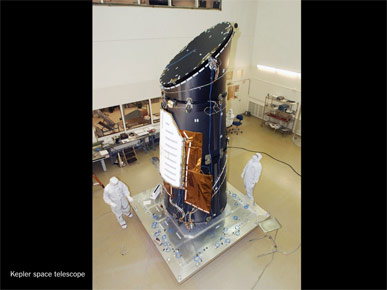
It's not until you pull back and see a human form that the size of the telescope becomes apparent.
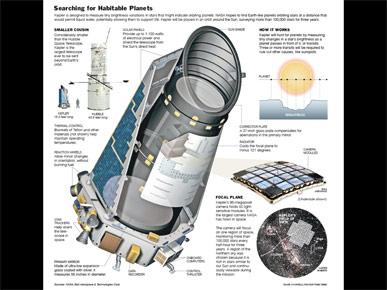
So when Frank made a graphic about Kepler ...

... he included a small silhouette of a person, along with the Hubble telescope for comparison.

There's even a tiny silhouette tucked into the corner of this graphic ...
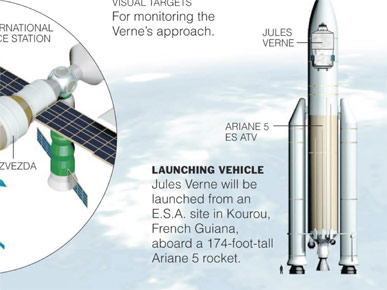
... to give the launcher a rough sense of size.
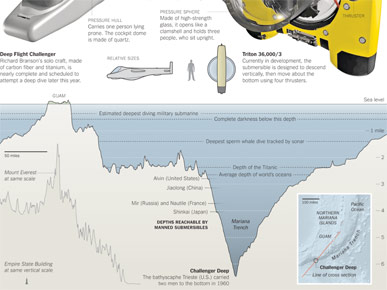
I've used the same drawn-to-scale man in graphics like this, which is about the deepest point in the ocean.
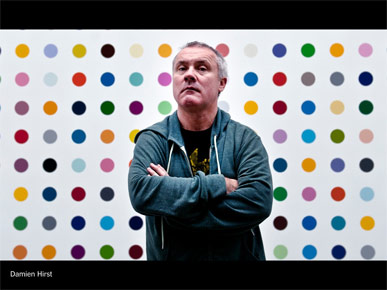
And Amanda Cox from the Times — you're probably familiar with her work — used the same drawn-to-scale man in a graphic about the spot paintings of the artist Damien Hirst.
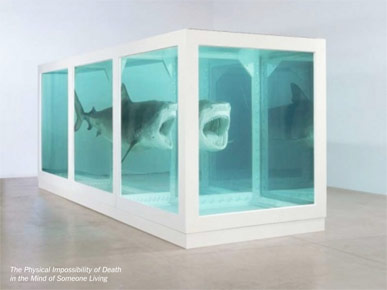
Damien's most famous piece is a shark in a tank of formaldehyde.
I really wanted to find an example where he had used a rubber duck in his artwork. I couldn't find one ...
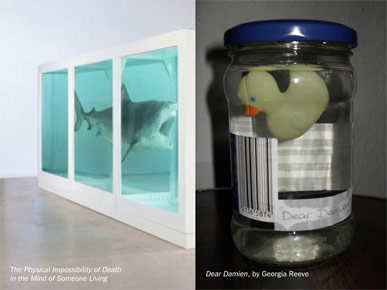
... but I did find an amateur artist who placed a duck in a jar of vodka, and titled the piece "Dear Damien."

She began with price data ...
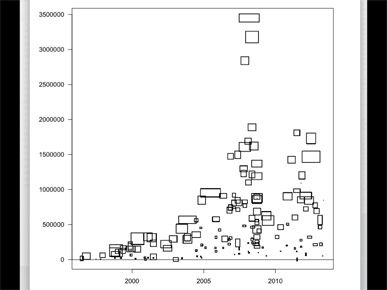
... and began sketching this lovely scatter plot, using the actual dimensions of each of the paintings for the individual data points.
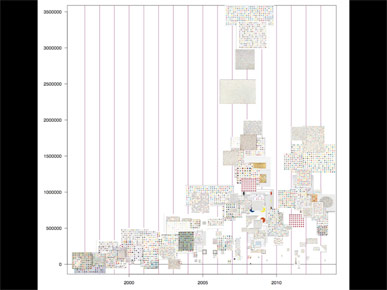
She then tried using images of the artworks, but there are some color issues with the different photographs.
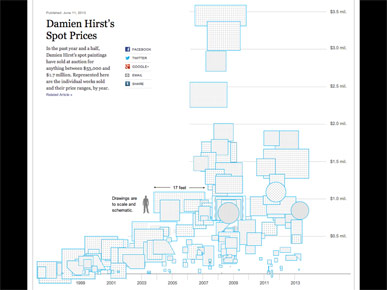
This is the final version, which used dot patterns to represent each artwork ...
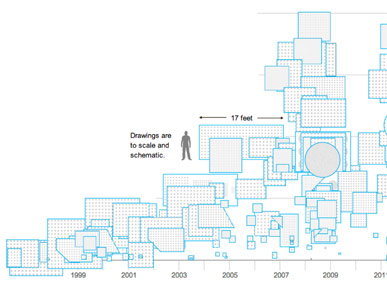
... and it included this beautiful detail of drawn-to-scale man, along with a small scale bar.

So, why this man in particular? I don't have a great answer for you.
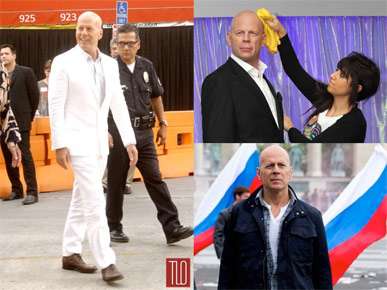
He does look a little like Bruce Willis, so that might be part of it ...
... but the real reason is that by using an image of a person we can give readers an instant impression of scale.
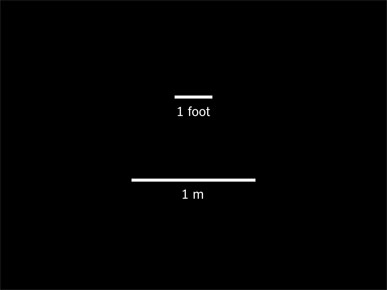
For example, some people in this room think in metric, and will have a very good idea of what one meter looks like. Other people (like me) might think in a different scale.
Including a numbered scale asks readers to make a small translation in their heads. A translation from what they think the measurement is to the line they see on the page.
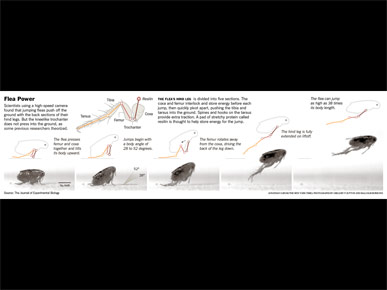
This is a graphic I made several years ago, explaining how a flea jumps.

I couldn't find a familiar object to compare with the flea, so in the lower corner there is a small scale bar showing 1/32 of an inch (just under 1 mm).
Asking readers to decipher unfamiliar measurements like this is a minor thing, but it's not ideal. The graphic asks the reader to decide how large 1/32nd of an inch is, and then match that idea to this bar.
It helps that people already know that fleas are small, but I probably could have done a better job here.
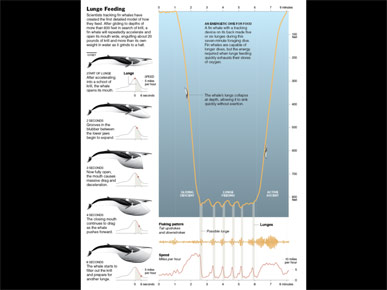
This graphic shows a whale diving to about 900 feet, feeding and then returning to the surface.
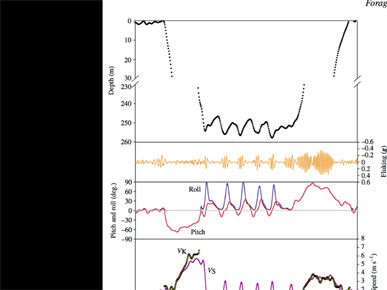
When I first saw the dive chart in a paper, it looked like this. The black line shows the whale at the surface, then diving more than 250 meters to feed.
But the scientists cut out the middle of the chart! That left room for more data below and highlighted the deepest part of the dive. There's nothing wrong with that, but it does make it hard to show the full vertical scale.
So the first thing I did was to get in touch with the scientist and ask for the full set of data.
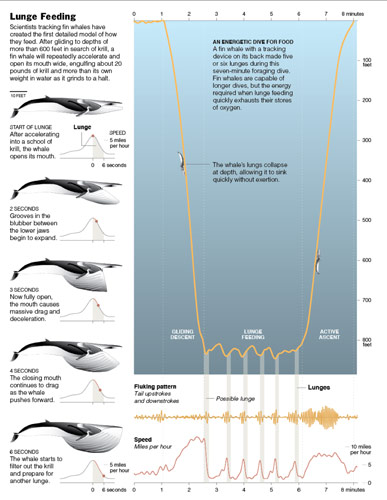
And when you show the whole dive, it looks something like this.
There are numbers on the chart showing the depth in feet, but I wanted to give an impression of depth even if you stripped the numbers away. So I added a drawings of the whale, at scale, riding the line up and down.
Even if you're not sure exactly how big the whale is, you can still get a sense of the number of body lengths the whale descends. And I tried to make the rest of the design support that feeling of depth.
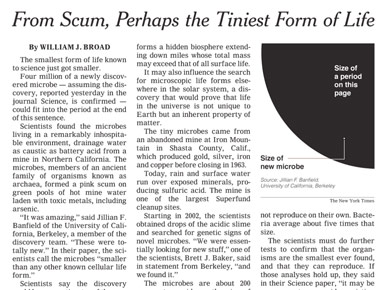
Amanda Cox did away with scale completely in this graphic about the discovery of a new microbe, possibly the smallest form of life.
Instead of trying to show size with a nanometer scale or something like that, she used a purely visual scale.
She took a period on the page (a small duck) and enlarged it, then compared the microbe to that larger period.
It's a sophisticated visual translation she's asking our brains to make, but we do it effortlessly.
All of us have experience with the scale of a city, a sense of how people and cars relate to buildings.
I wasn't involved with this work, but many people on the Times graphics desk were. They wanted to see what would happen if you brought some events from the Sochi Olympics into New York City.
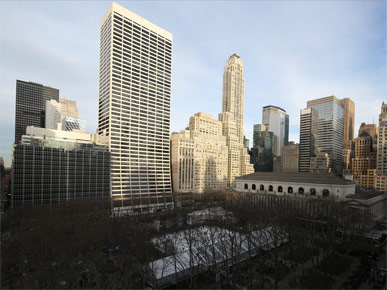
This is Bryant park, a small park near the Times, and the New York Public Library is the long building at right.
Even if you've never seen this park before, you can begin to get a sense of scale from the building windows and trees.
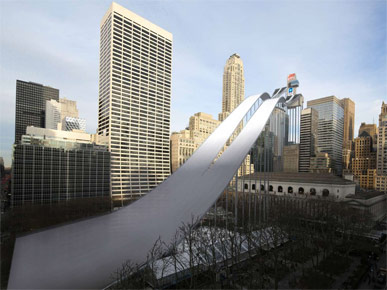
This is what the park might look like if you moved the ski jump from Sochi into the park.
Right? It's very different sense of scale than if you just saw this structure on the side of a mountain.

This is the luge track crammed into Times Square. Before I saw this I had no idea how long a luge track was.
There are people visible here, at the bottom, but it's the buildings that give a sense of scale.
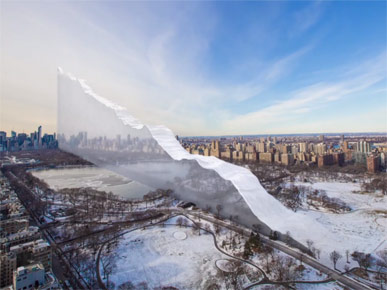
And here is slice of the downhill course dropped into Central Park.
Here we move back to human scale, using composite images of a person to show scale and movement and distance and time.
Here a faint connecting line helps give a sense of height.

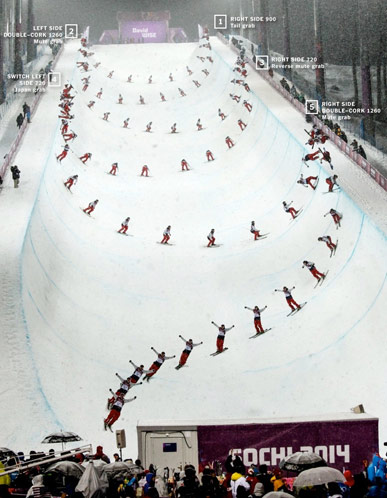
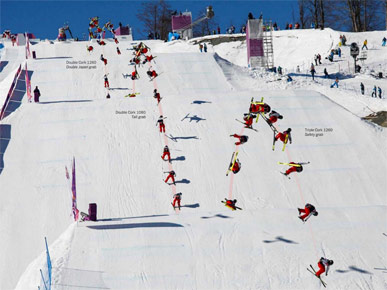
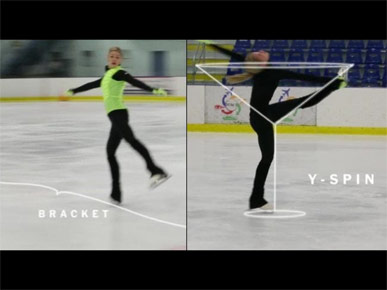
And here are two ways of showing a slalom run, one using icons to indicate relative speed ...
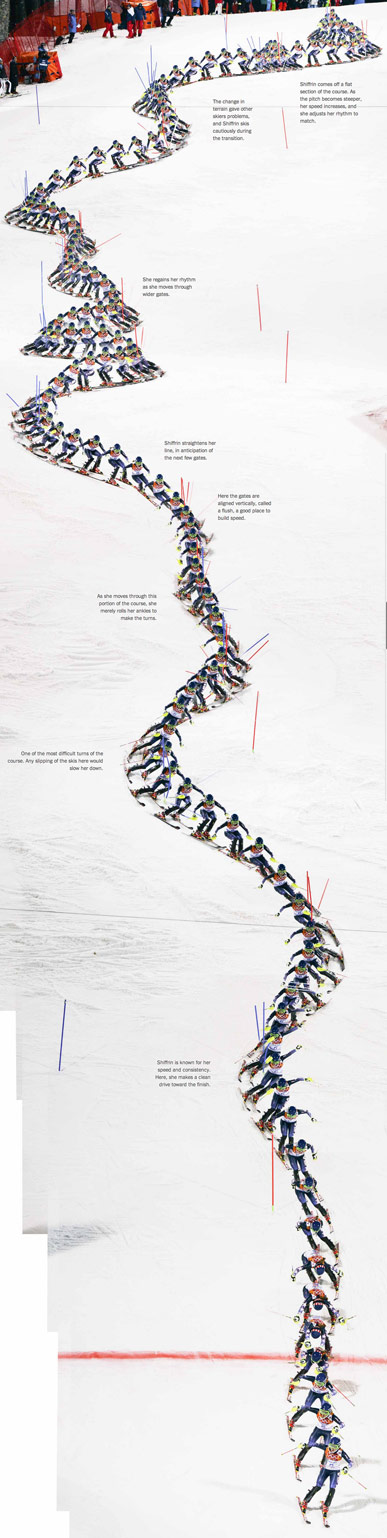
... and one following the sinuous track of a gold medalist through the course.
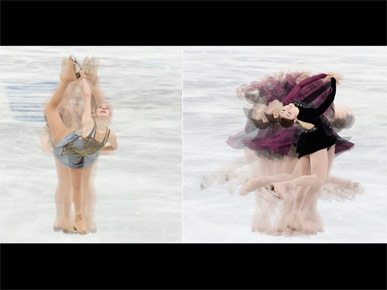
By overlaying images you can begin to get a sense of a person moving in time.
You can make comparisons like this ...
... or annotate the human form.
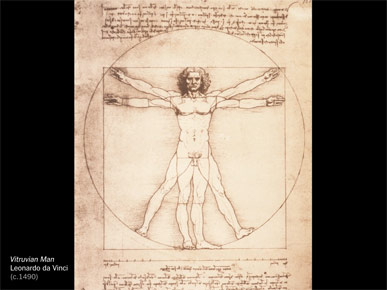
We're certainly not the first people to do this.
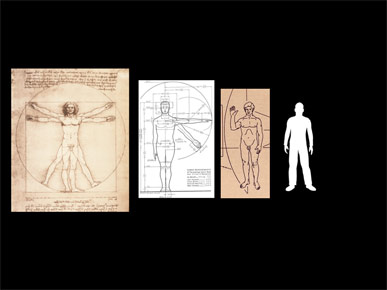
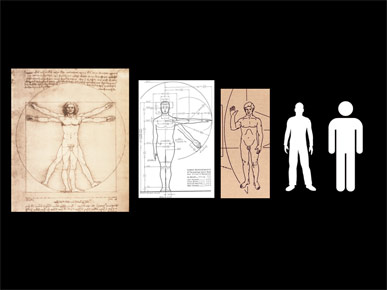
In this famous image, Leonardo da Vinci added scale and proportion to the human form.
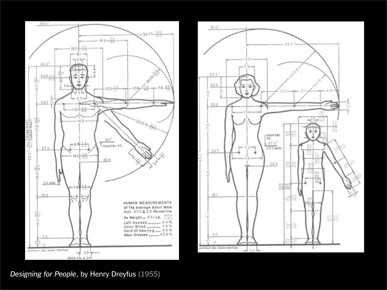
A similar idea was picked up in 1950s industrial design, as designers begin to think more carefully about how far people can reach, what the eye can see, and so on.
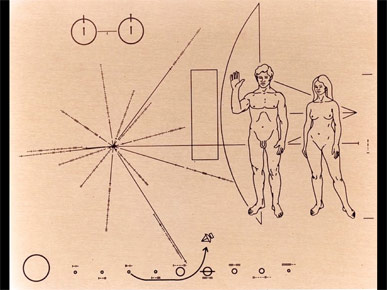
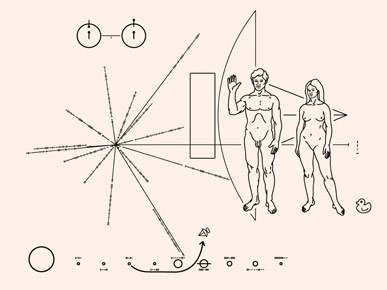
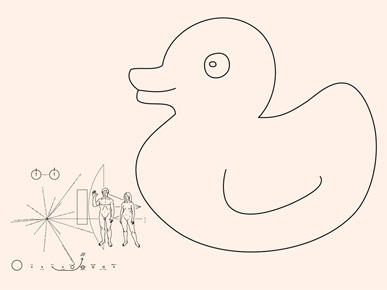
And the idea also appears in the famous Pioneer plaque of the 1970s.
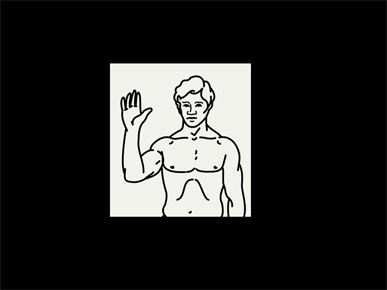
As an aside, I love this 70s style of drawing. The closest I've been able to come to it ...
... was a drawing of my coworker Sergio for a graphic about sign language.
I left out details of his face, but couldn't get rid of the great 70s-style hair.
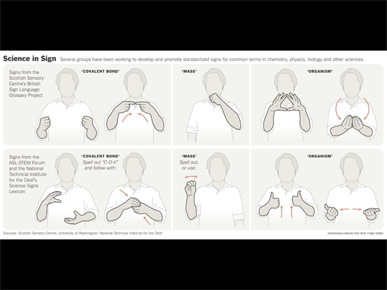
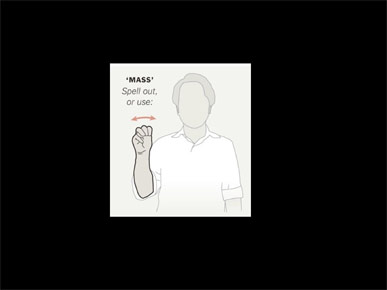
Here's the full graphic, about science terms in sign language.
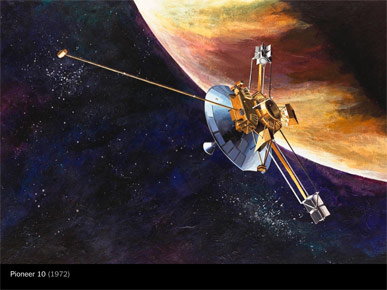
This is the Pioneer spacecraft, which carried the plaque. It was launched in 1972.
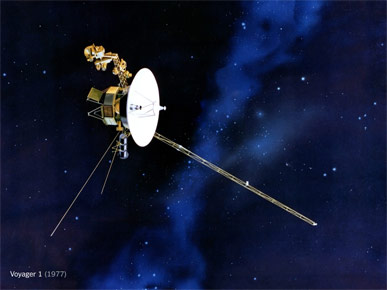
And this is Voyager, which was launched a few years later but eventually overtook Pioneer.
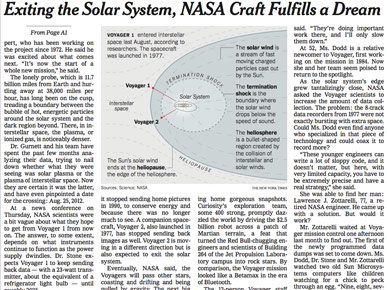
Last fall NASA announced that Voyager had finally left the solar system. Sometimes I get a little too close to the news, and started working on what is essentially a map: here's the solar system, here are the two Voyager spacecraft.
But the graphics director wanted something that showed the immense scale. Voyager had traveled 11.7 billion miles, or about 19 billion kilometers. And he wanted something for the front page that helped readers understand that distance.
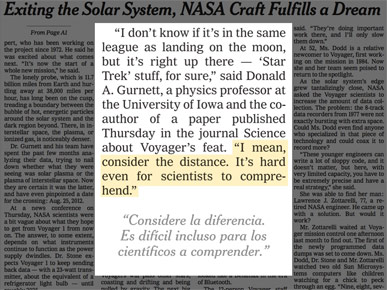
There was also a great quote in the story. One of the scientists said: "I mean, consider the distance. It's hard even for scientists to comprehend." So that was a good challenge.
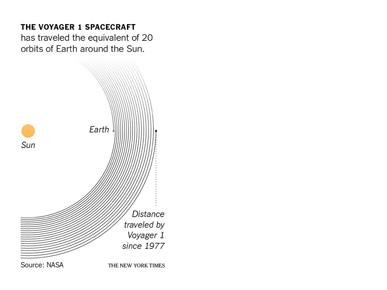
I started thinking about large distances that people might have some general idea about. Maybe the number of times the Earth moves around the sun, or things like that.
I started sketching ...
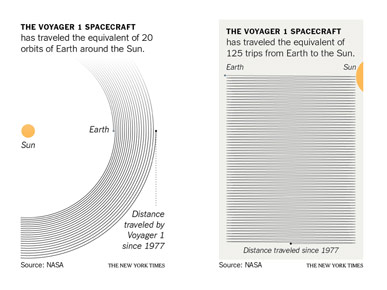
... and eventually came up with this, comparing the total distance traveled by Voyager to the distance between Earth and the sun.
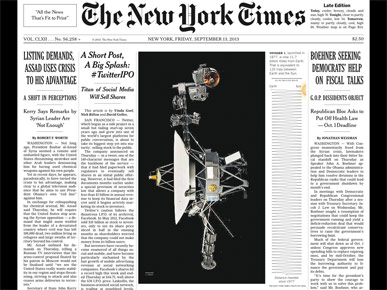
It started as a small graphic, but the graphics director was able to get more space on the cover, and it ran like this.
It's essentially a large caption about scale.
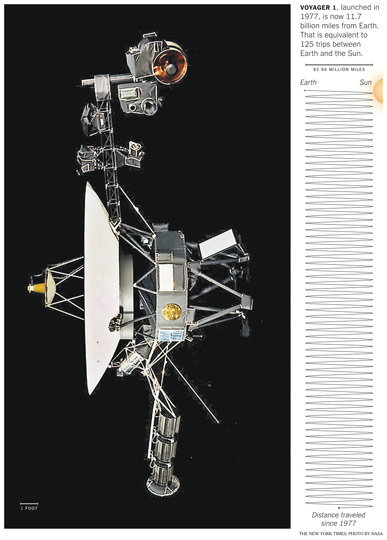
It didn't seem appropriate to add a silhouette of a person to the Voyager photograph, so I used a small scale bar for one foot, at lower left. Without that line it's hard to tell how big the spacecraft is.
The next day someone stopped me in the hall and said "When I saw that scale bar, I knew it was one of your graphics." I thought that was a very nice compliment.
The small gold circle attached to Voyager is the Golden Record.
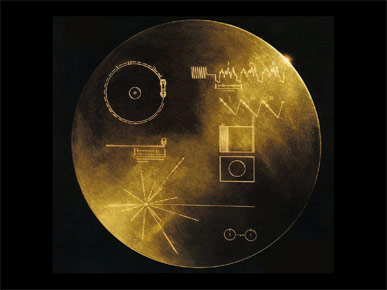
This was the first infographic to leave the solar system!
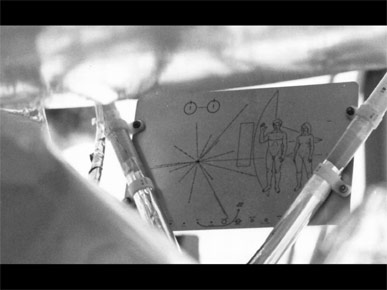
And the Pioneer plaque will be the second unique design to leave the solar system.

The information on the plaque is very heavily encoded.
The two circles at upper left set the scale. The circle represents a hydrogen atom, with a transition that gives both distance and time. And that scale is used throughout the graphic, from the height of the woman to our location in the galaxy.
And it's interesting that the people don't give scale to the outline of the spacecraft, but the other way around. Whoever finds the plaque would presumably have the spacecraft, and could use it to tell how large we are.
And the reason for this dense encoding is that we are not the audience. The audience is an alien intelligence, like this.
This is a classic problem — if we could communicate with an alien, how would we explain how tall we are, what we look like, what side of the body our heart is on?
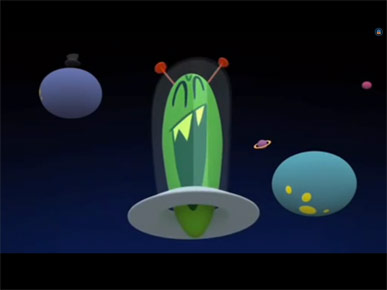
Even my son is aware of a version of this problem.
In the cartoon Pocoyo there is an angry alien ...
... who comes to Earth planning to take over the world.
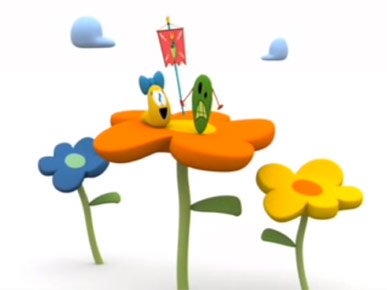
But it's not until he arrives that he realizes he's only as big as a caterpillar.

He could have used this plaque! He is the intended audience for this information.
So if you're designing for an alien, feel free to encode all you want. But if you're designing for a human audience, the design should be as intuitive as possible. I try to encode as little as possible.

This is all part of respecting your reader, your audience.
We've been talking about different uses of the human form, but there is one that I've omitted so far.
And that is this famous icon ...

... which adorns bathrooms everywhere.
Icons like these do have problems, but in certain cases they can be very useful for scientific communication.
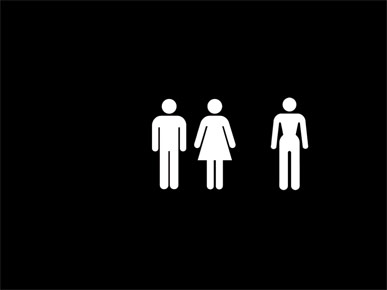
And I was interested to learn this week from Mats Odéen that his newspaper, Dagens Nyheter, has abandoned these icons in favor of a more gender-neutral icon.

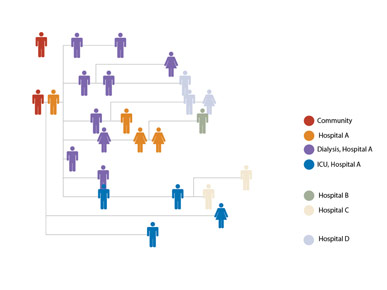
For example, this was a paper about the spread of a virus in Saudi Arabia. The virus had infected people and was spreading through several hospitals there.
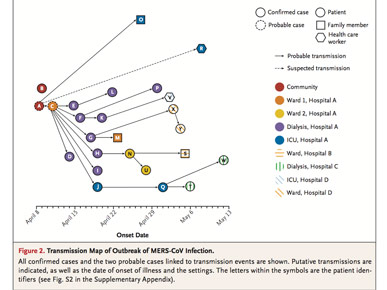
And the paper had this chart, with dots and lines showing how the infection had spread from person to person.
But it's very densely encoded.
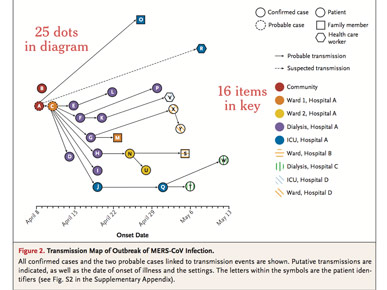
There are 25 dots in the chart, but 16 items in the key! That' almost a one-to-one ratio.
Scientists love to make things abstract. They use dots, squares, triangles in graphics. But when I see graphics like that I just want to tell them: "Dots are people too!"
So I wanted to remove some of the encoding and add a little humanity back into the graphic, taking it away from the abstract shapes.
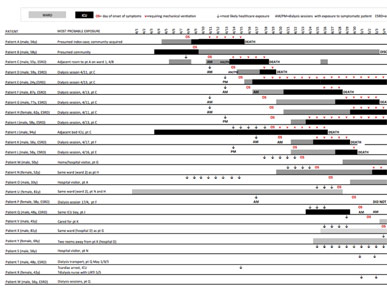
In the supplemental information for that paper there was this chart, which listed more information about each person. Certainly not the name, but the age and gender.
So I tried to add some of that information back into the chart ...
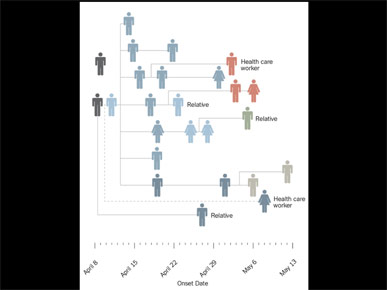
... simplifying the color scale ...
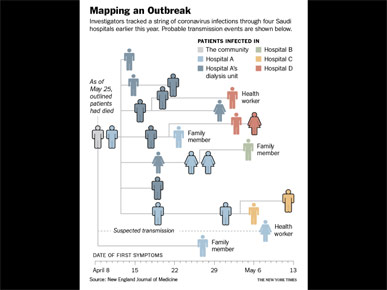
... and eventually coming up with a finished graphic.
It's very similar to the original chart, but hopefully easier to read and a little easier to see patterns in.

This is another example of the spread of flu in a school. The paper was trying to show that little girls were more likely to catch flu from other girls they played with, instead of from the boy they sat next to in class, and vice versa.
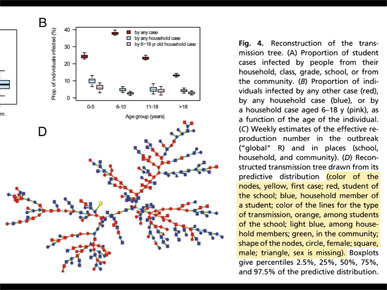
There is a scale here, but it's all text. So the graphic is asking us to read text about shapes and colors, hold that information in our heads and then try to use it to translate the chart.
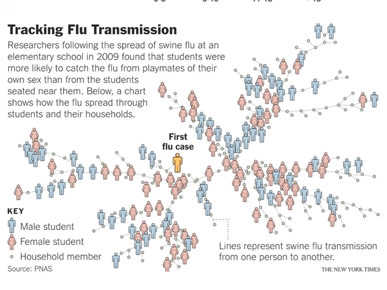
I used a similar format, but added icons for the boys and girls, to make the lines of transmission a little clearer.
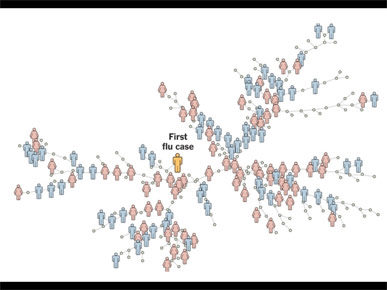
My goal was to make the chart understandable even if almost all of the text had been removed, like this.
Sometimes, I feel more like a translator than a designer. Trying to translate the point the scientist is trying to make to a wider audience, and removing all of the jargon.
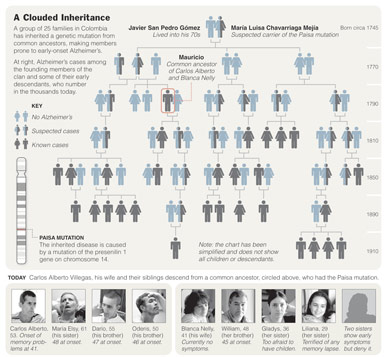
Icons can be useful for showing disease inheritance in an extended family. Here, combining abstract icons with photos of some of the individual people.
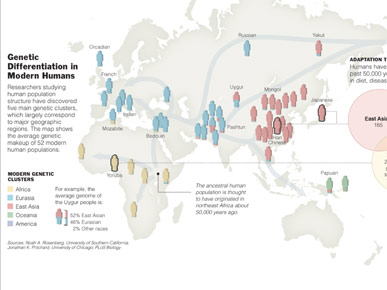
And icons can sometimes be used as containers for data, here representing human populations.
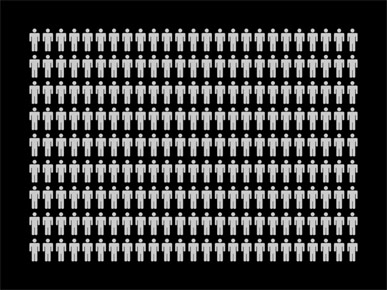
But I try to avoid graphics like this, that use icons of people just to count something.
For me, there has to be some comparison, some connection, some additional information involved. Not just counting up to a single number.
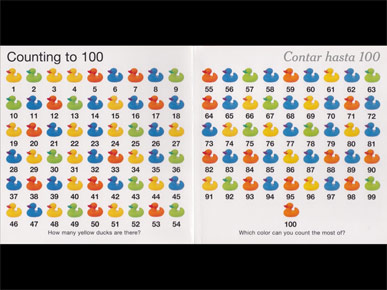
That's too much like this children's book — using ducks or other objects to learn to count.
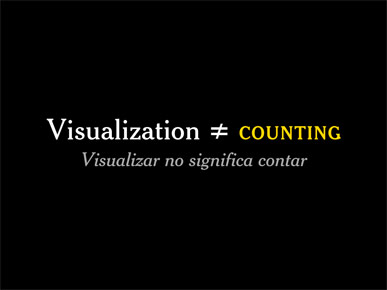
I've used this slide before, but I thought it was worth repeating. I strongly believe that data visualization has to do more than just count, more than just show what some data looks like.
If I visualize something and walk away without trying to explain it, then I haven't done my job.
My interest is in understanding something, trying to hone that understanding, and then sending that information out in the world in the hope that someone else will understand it.

And even when I do use dots, or in this case lines to represent people, I try to emphasize that it really is a person, and I try to remember that there are people behind the data.
This graphic shows all 779 Guantánamo detainees, each a line stretching across time. I couldn't add all the individual names, but I tried to add just enough annotation to make it clear.
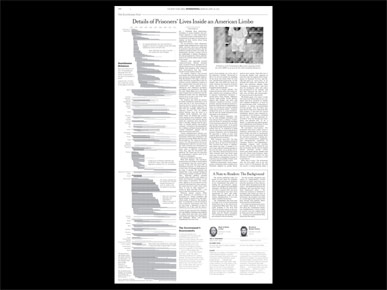
Here it is on the page.
I made this graphic and it ran in the paper, and a couple people said they liked it, and then it was forgotten. But the following year it won an award at Malofiej, which pulled it back out of obscurity and got people talking.
So I think that Malofiej is a great opportunity for us to come together, to look back over the work that's been done in the past year, and to take some pieces out and say: "Look at this. There's something here."
I've been talking about working at a human scale, but sometimes that's hard to do.
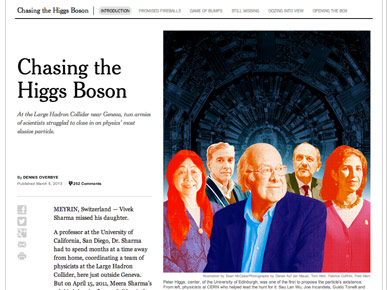
For example, last year's announcement that scientists had discovered evidence of the Higgs boson.
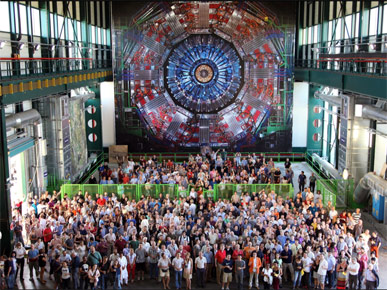
It's very easy to show the scale of the machines they used to find the Higgs. Here are scientists in front of one of the experiments.
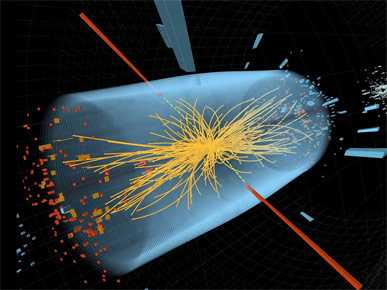
And it's not hard to show the explosions and movements of particles within these machines.
But it's very difficult to show or explain anything about the particles themselves.
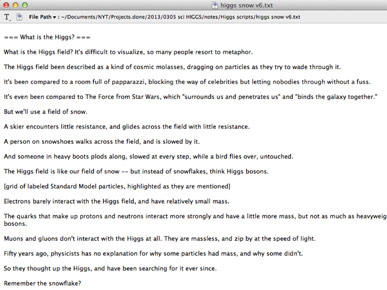
I wanted to bring different particles up to human scale and human experience, and explain them.
So I started our graphic on the Higgs by writing a script. I've been doing this much more frequently — starting a graphic with a script or a simple storyboard.
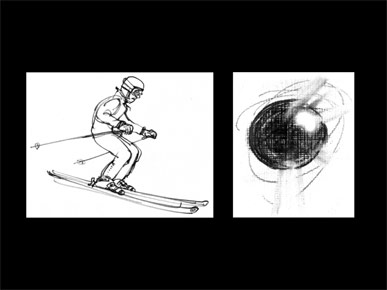
And we worked with Nigel Holmes to come up with these lovely sketches of people in motion, and of particles.
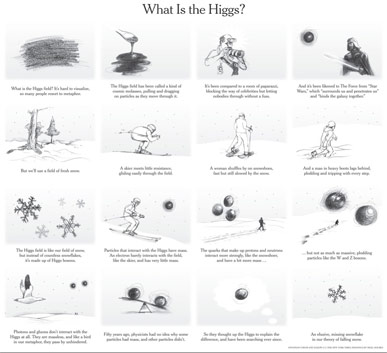
And here are those illustrations assembled into a final graphic. It explains some of the metaphors that have been used to try to explain the Higgs, and then expands the metaphor of a field of snow.
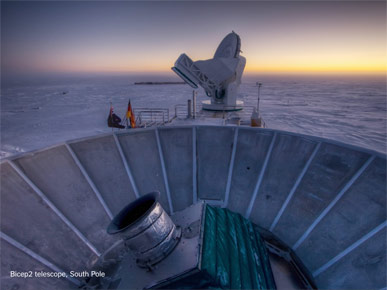
And we tried a similar approach last week, when this telescope, Bicep2, found evidence to support the theory of inflation.
Inflation was the violent expansion of the universe in the smallest trillionth of a second after the Big Bang.
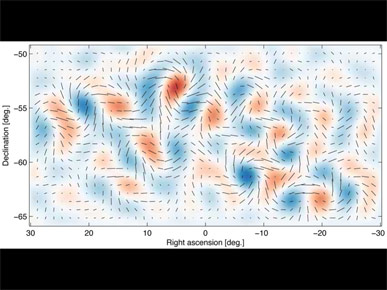
And with the discovery came images like this, of gravity waves and temperature differences in the early universe.
I wanted to use this image but could not find a good way to do it. So I wrote a script ...
... and we incorporated that image into one of the illustrations.
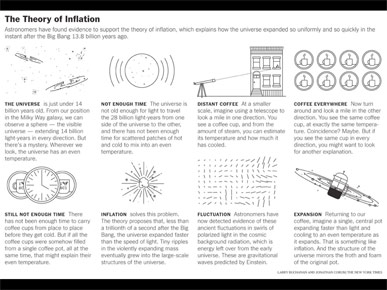
This metaphor tries to pull the universe down to something you could hold in your hand, a cup or a pot of coffee. The graphic explains the idea using coffee cups scattered throughout a city, then expands back out to the scale of the universe.
The elegant illustrations are by Larry Buchanan.
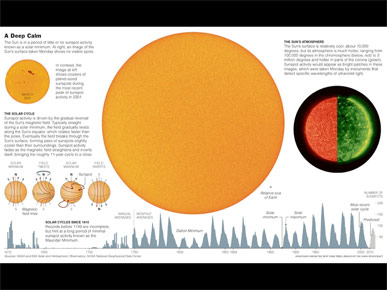
As we leave human scale behind — in this case for a graphic about the lack of sunspots — I still try to give people something to hang on to.
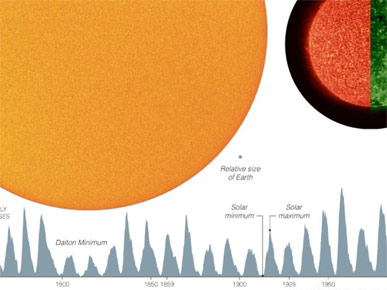
There is a small Earth next to the sun, which is an attempt to say: "You are here!"
Without any reference to Earth, it just becomes a yellow ball.
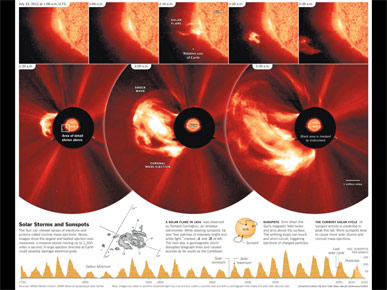
And later, when sunspot activity resumed, I did the same thing for this graphic.
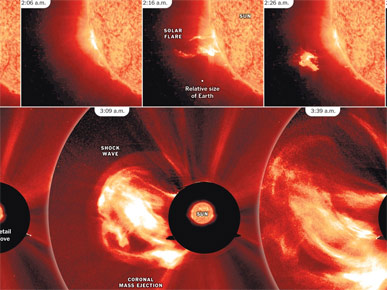
These images show a massive solar flare. I added a small white dot for Earth in one of the initial frames, just to give some scale to the incredible size of the flare.
And I added a sun to the black circles in the lower frames, so that the scale of the sun is not lost.
As we leave the sun behind and look at other stars, the same idea applies.

Here the sun and the inner planets of the solar system help give scale to other types of stars.

And as we begin to discover new planets, I tried to compare them with our solar system, whether by showing the relative size of Mercury's orbit or the relative size of our sun.
Without scale these are just abstract groups of planets.

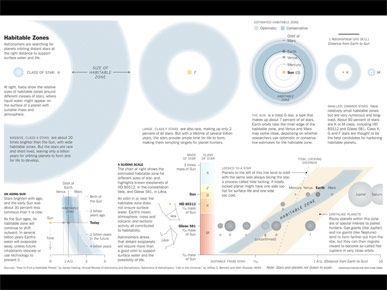
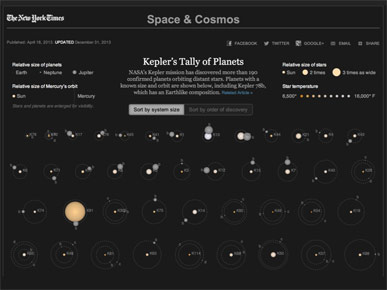
But I got tired of explaining one planet system at a time, so came up with this framework to compare multiple systems.
I showed an animation of the graphic, but you can find the real thing here.
If you haven't seen this before, it begins with small planets and compares relative sizes and speeds. As we scroll down we begin to see things like binary stars, two stars circling around each other, and NASA artist's renderings of interesting planets, and at the very bottom we see the sun and Earth for comparison. You are here.
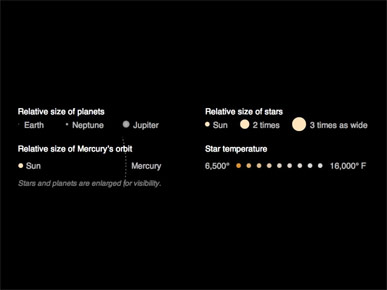
The graphic uses four scales, plus time: two for size, one for distance and one for temperature.
And I worked hard to make the scales as intuitive as possible ...
... so that even if readers never noticed the scales, they could still understand what I was trying to show.
In all these examples I've been trying to show that thinking about scale is a type of empathy. A way of thinking about your reader and trying to communicate.
Last month Alberto Cairo gave a couple talks where he spoke about features that define a great infographic or data visualization.
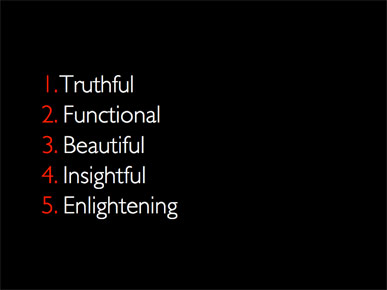
And he came up with these five: Truthful, Functional, Beautiful, Insightful and Enlightening.
I think these five can be very useful in looking at graphics, and judging graphics and comparing graphics.
But I realized that I don't think about all of them when I'm working on a graphic, except for the first one about being Truthful.
When I'm working on a graphic, I tend to think about what I can control.
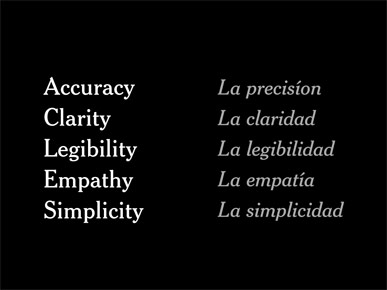
And the things I can control are:
Accuracy. Truth is elusive, especially in science, so I try to make sure I'm accurate based on our current knowledge.
Clarity of thought, presentation and design.
The overall Legibility of the graphic.
Empathy and respect for what the reader might and might not understand. Trying to remember what it's like not to understand something, and then thinking about the easiest way to lead a reader to a point of understanding.
Simplicity of form: are there extra marks that could be removed?
From these, I hope that several things might emerge in the finished graphic.
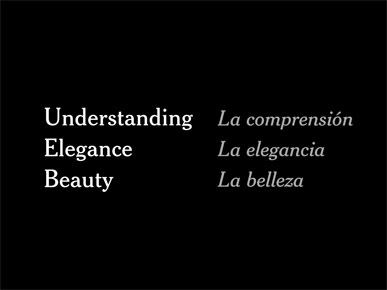
Understanding is the first and most important.
I would also hope that, in a good graphic, the reader might get a sense of Elegance.
And sometimes a finished graphic might be beautiful. But Beauty is not necessary, and we have to be very careful about beauty.
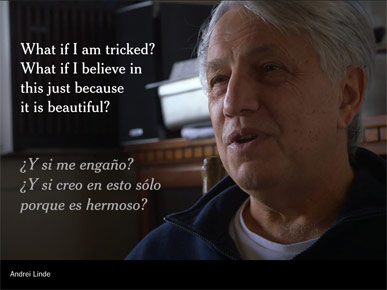
Andrei Linde, the scientist who proposed the theory of inflation, had a lovely quote in a video last week when he heard that his theory might be correct.
He said that for the past 30 years he'd been thinking: What if I am tricked? What if I've fooled myself? What if I believe in this theory just because it is beautiful?
So I would urge you, as you work, to always put understanding before beauty.

And if your data consists of ugly ducks, that's ok.
Please don't try to decorate them or make them beautiful.
Please try to use all your data, not just those parts that make a great story.
And please remember that there is a big difference between a duck like this, in the lower right corner ...
... and a duck like this.
Thank you very much!